
Environmental data needs to be visualized to be effectively communicated.
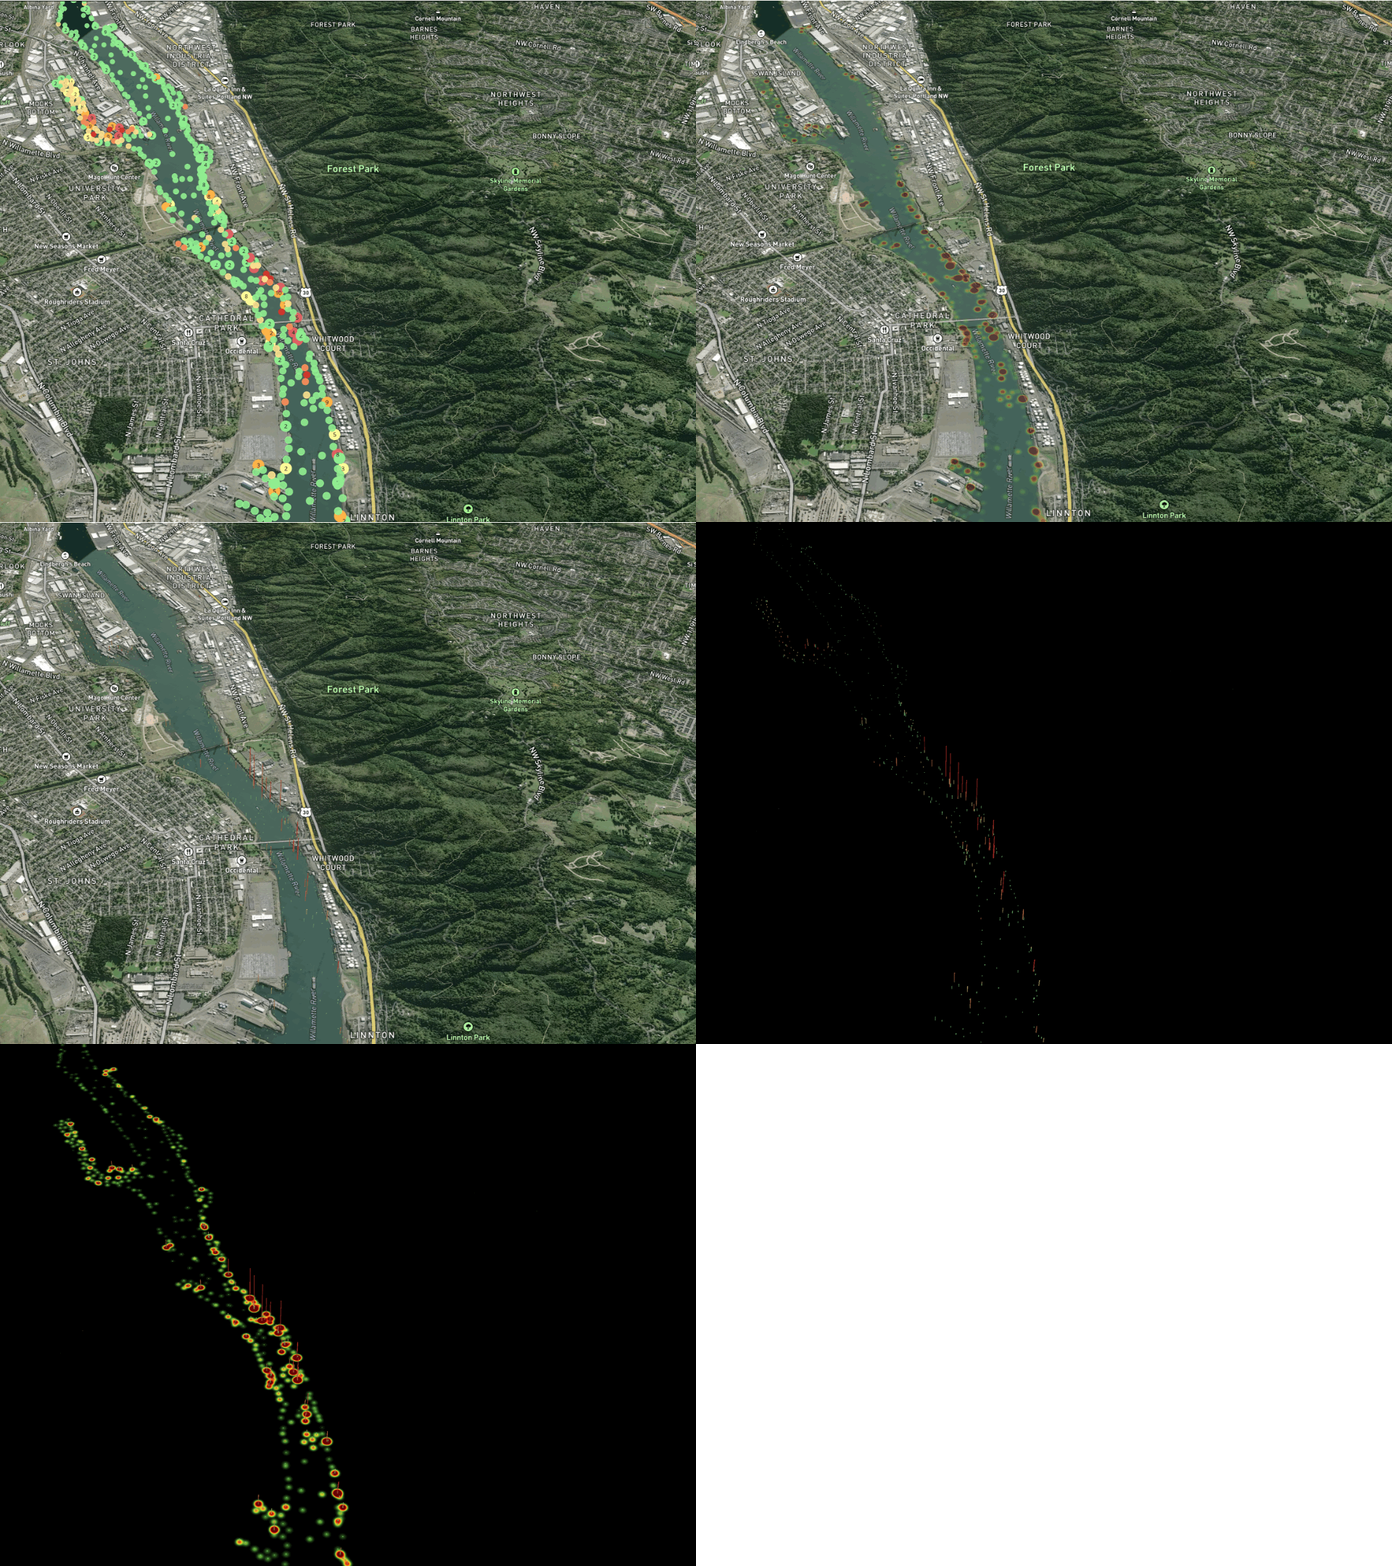
Selecting appropriate visual representations is critical depending on the context—whether displaying sample locations relative to guidelines or using alternative display modes to highlight specific areas. Statvis provides multiple visualization options that become available within minutes of uploading data, eliminating lengthy waits for graphics or GIS-generated figures.
The data shown here comes from the Portland Harbour Superfund site's public database as an example.
Good science is only done once it is communicated in a way anyone can understand.
Contact us to see how Statvis facilitates both data exploration and communication for contaminated site analysis.