
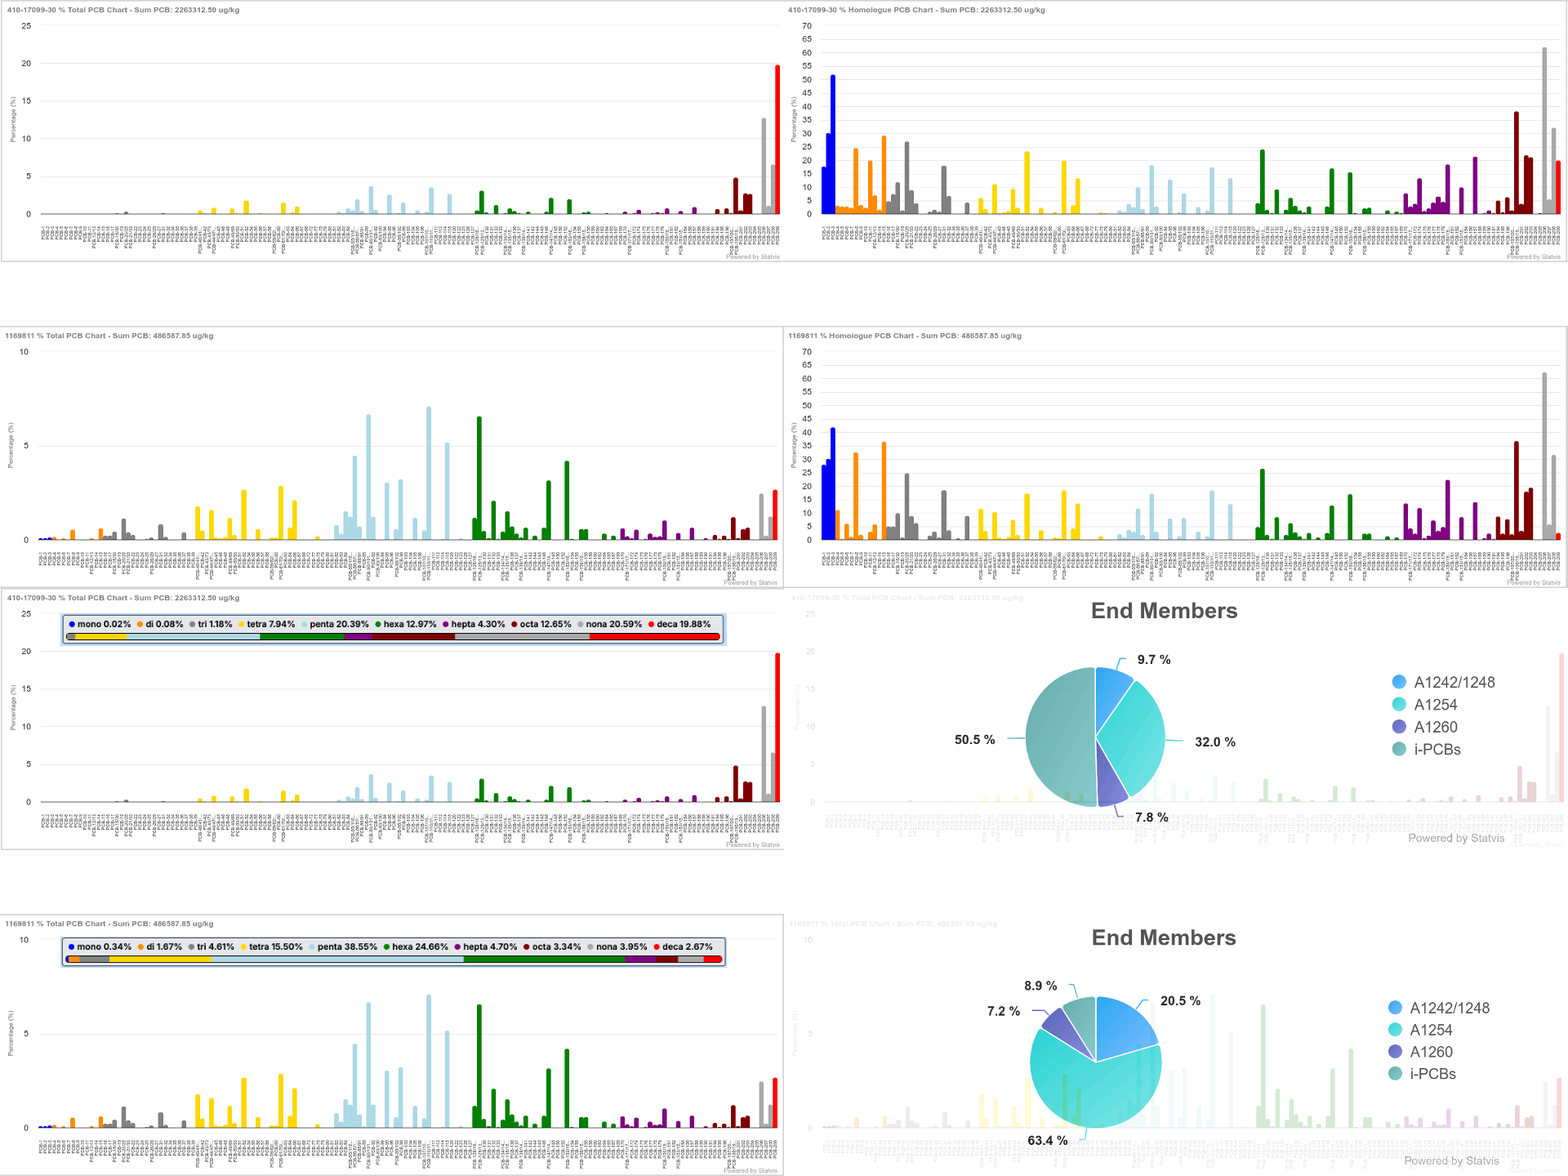
Statvis delivers effortlessly interactive PCB data analytics compared to spreadsheet-based approaches.
Instant Data Access
The platform consolidates historical project data while maintaining separate records for each dataset. Users can filter interactively by multiple parameters including date, depth, project area, laboratory source, and status indicators.
Standardized Workflows
Features include:
- Automatic graph formatting. Consistent comparisons across samples and projects.
- Display toggles. Switch between percentage total and homologue displays.
- Aroclor calculations. Generate Aroclor values from congener results automatically.
- Reference comparisons. Compare against commercial mixtures using Frame, Rushneck, or Pacific Rim standards.
Explaining Complex Science
Users can select visualizations highlighting patterns and trends, display individual or calculated components, generate sample report cards, and perform sample comparisons. All of this is available within interactive portals featuring data, graphs, maps, and shapefile layers.
Spreadsheets make a few of these things possible slowly and painfully, as flat contextless charts. Statvis delivers interactive functionality seamlessly.