Finding the location of your samples worldwide has never been simpler with Statvis.
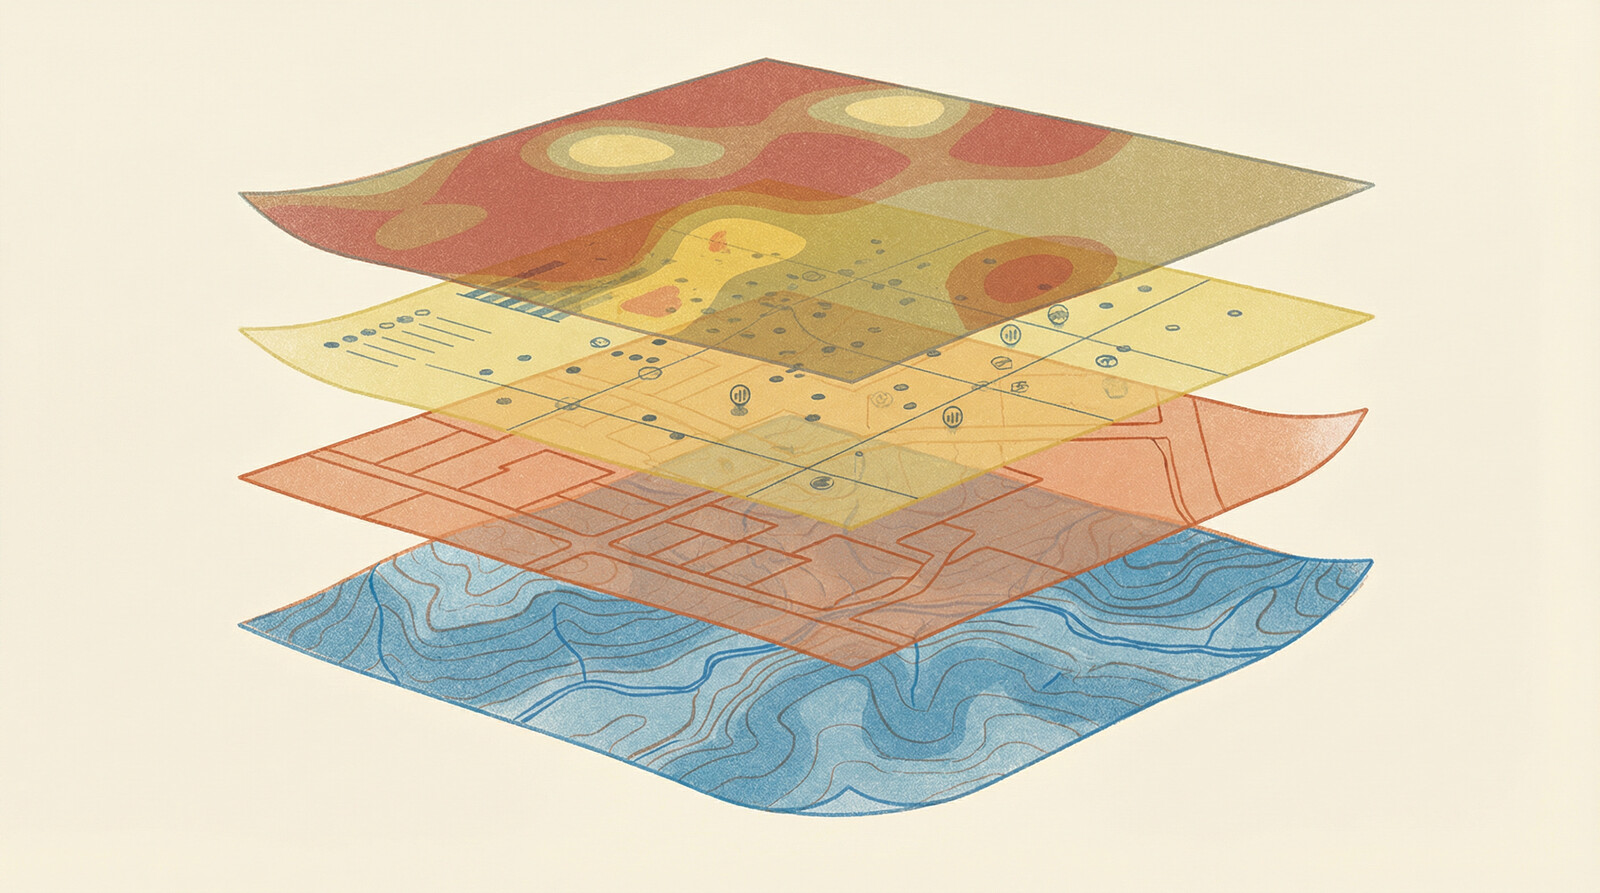
The platform enables environmental professionals to visualize sample locations on interactive maps. Users can easily spot variations in monitored contaminants based on concentrations or chemical signatures.
Custom Layers
The tool supports adding property boundaries to analyses, such as showcasing areas with oil sands development.
Geospatial analysis is now accessible and quick with Statvis, seamlessly integrating with other data exploration features.
Contact us to see how Statvis Analytics can support your environmental data needs.